Why is my website slow?
Almost everyone starts by compressing images. Sometimes that is the answer. More often the time has already been spent before a single image is requested, and the compression work changes nothing. This guide shows you how to find out which one you are, in about ten minutes, before you pay anyone.
Quick answer: "slow" is three separate measurements. Google's targets, at the 75th percentile of real visits, are LCP 2.5s or less (loading), INP 200ms or less (responsiveness) and CLS 0.1 or less (visual stability). Roughly 80% of your LCP is server response time plus the download of your largest element, so the two things to check first are your hosting and your largest image. Check field data, not your Lighthouse score.
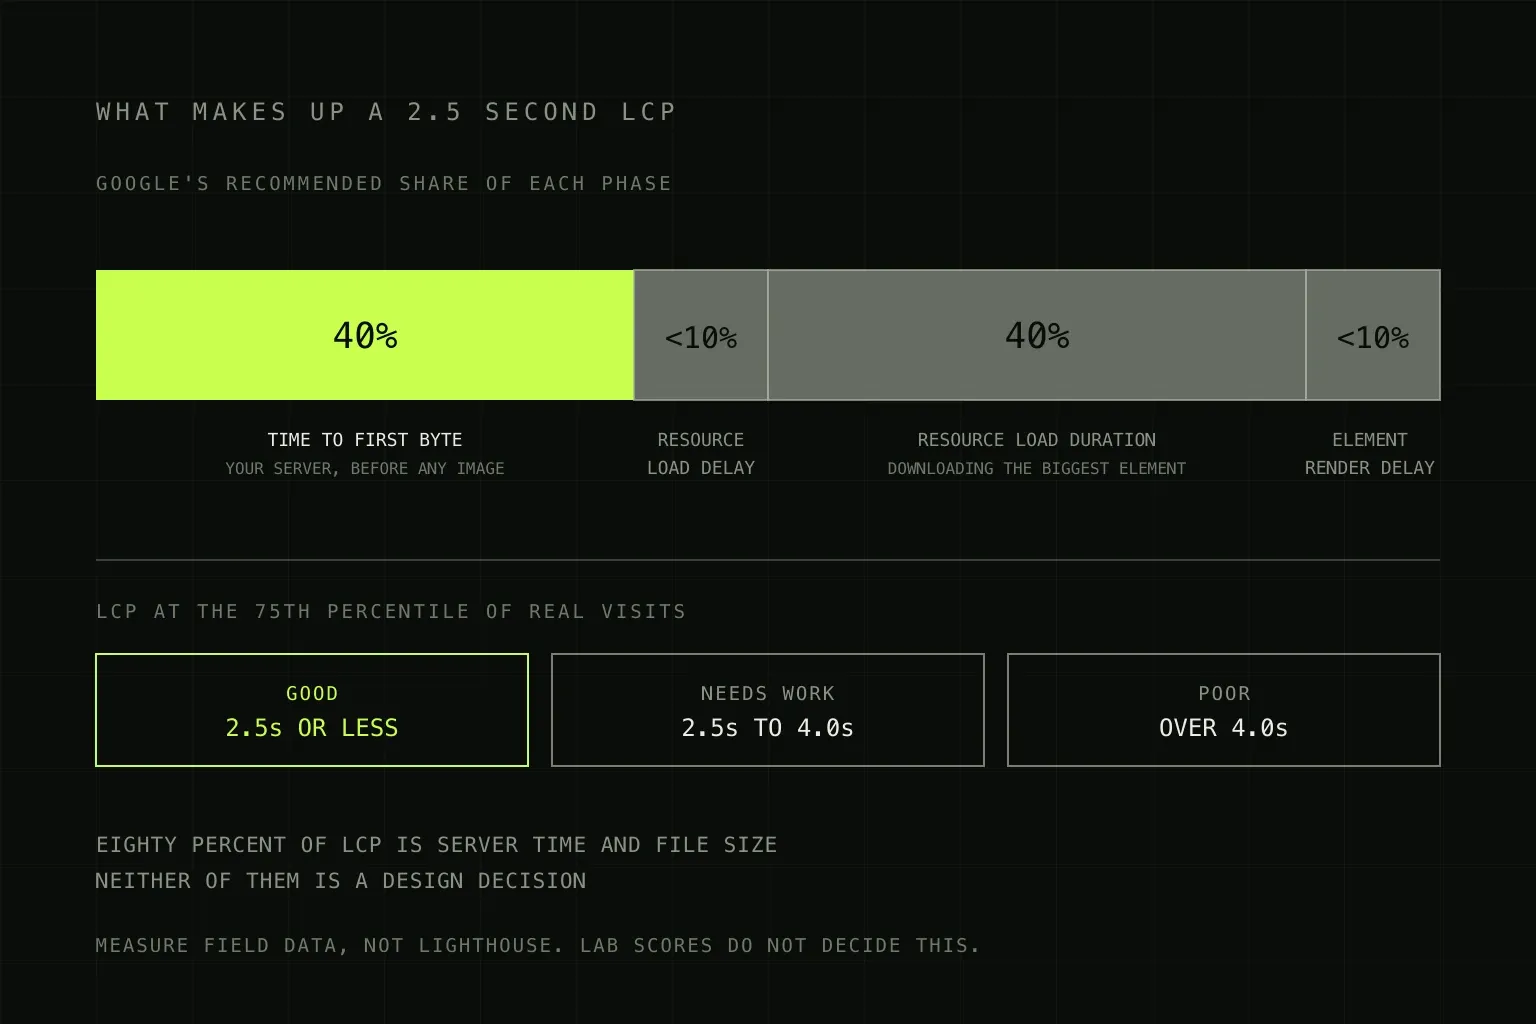
Google's own recommended breakdown. Two phases hold 80% of the time.
"Slow" is three numbers, not one
There is no single page load time any more. Google retired that idea when it introduced Core Web Vitals, and it now assesses three things separately, because a page can be quick to appear and horrible to use, or instant to click and slow to paint.
| Metric | What it measures | Good | Poor |
|---|---|---|---|
| LCP Largest Contentful Paint | How long until the biggest thing on screen has drawn | 2.5s or less | Over 4.0s |
| INP Interaction to Next Paint | How long the page takes to visibly respond when someone taps or clicks | 200ms or less | Over 500ms |
| CLS Cumulative Layout Shift | How much the layout jumps around while loading | 0.1 or less | Over 0.25 |
Two details matter more than the numbers themselves. First, all three are assessed at the 75th percentile of real page loads, so you are being judged on your slower quarter of visits, not your average one. Second, INP replaced First Input Delay as a stable Core Web Vital in 2024. If a report or an agency is still talking to you about FID, it is reading from an old script.
Where the time actually goes
This is the part almost every "speed up your website" article skips, and it is the part that decides what you should pay someone to do. LCP breaks into four phases, and Google publishes what share each should ideally take.
- Time to First Byte, around 40%. Your server receiving the request and starting to answer. Nothing has been downloaded yet. Nothing has been drawn.
- Resource load delay, under 10%. The gap between the HTML arriving and the browser starting to fetch the biggest element. Usually caused by the browser discovering that image late, because it is behind JavaScript or a CSS background.
- Resource load duration, around 40%. Actually downloading that element. This is the image weight and format conversation.
- Element render delay, under 10%. The file has arrived but the page has not drawn it yet, usually because something else is blocking the main thread.
Read the shape of that. Eighty percent of your LCP is your server responding and your largest file downloading. Neither is a design decision. This is why a beautiful, well-built site on cheap shared hosting fails Core Web Vitals, and why compressing a hero image on a site with a 1.4 second TTFB barely moves the number.
The five causes behind most slow sites
In rough order of how often they turn out to be the real answer:
- Cheap shared hosting. The single most common cause of a bad TTFB, and the one nobody wants to hear, because the £4 a month plan was a deliberate saving. If TTFB is over a second on a page that should be cacheable, start here.
- Uncompressed, unsized images. A 3MB photograph straight off a phone, served at full resolution to a 390px-wide screen. Modern formats and correct dimensions routinely cut that by 80% or more with no visible difference.
- Third-party scripts. Chat widgets, heat maps, three analytics tools, a cookie banner, a review widget and a booking embed. Each one was a five-minute decision. Collectively they are often the largest thing on the page, and they run on the same main thread as your site.
- Plugin accumulation. The WordPress-specific version of the above. Twenty-six plugins, each loading its own CSS and JavaScript on every page whether that page uses it or not.
- Rendering the page in JavaScript when it did not need to be. A brochure site built as a single-page app ships a framework, waits for it to boot, then draws text that could have been in the HTML. This is the expensive one, because it is not a setting.
The first four are configuration. They are a day or two of work and they usually get a site into the green. The fifth is architecture, and honest suppliers will tell you it is a rebuild rather than a tune-up.
INP: the one that catches interactive sites
LCP gets the attention because it is the one people can feel. INP is the one that quietly fails ecommerce stores, booking flows and anything with filters. It measures the delay between someone tapping and the screen visibly changing, across the whole visit rather than just the first interaction.
The usual culprit is main-thread work: long JavaScript tasks that hold the browser hostage while the user is trying to use a filter or open a menu. Sites with heavy product filtering, live search, or a stack of tag-manager tags are the ones that fail it. It is also the metric that is hardest to see in a lab test, because a lab test never interacts with the page the way a shopper does.
CLS: cheap to fix, disproportionately annoying
Cumulative Layout Shift is the metric behind that moment where you go to tap a link and an advert loads above it and you tap something else. Google's documented causes are consistent and mostly preventable:
- Images and videos served without width and height attributes, so the browser cannot reserve the space
- Content injected into the page after the fact, above content that has already drawn
- Web fonts that swap in at a different size to the fallback and reflow the text
- Third-party ads and widgets that resize themselves once they load
None of those needs a rebuild. CLS is usually the cheapest of the three to fix and the most visible to a human being, which makes it the best place to start if you want someone to notice the difference.
Measure the right thing
The most common mistake in this whole area is optimising for a Lighthouse score. Lighthouse is a lab tool: one simulated load, on a simulated device, over a simulated connection. It is genuinely useful for finding causes. It is not what Google assesses you on.
Google uses field data from real Chrome users, aggregated over 28 days. You can see it at the top of any PageSpeed Insights report, in the section above the score, and in the Core Web Vitals report in Search Console. If a site has too little traffic to have field data, Google says so, and in that case the lab numbers are all you have, but you should know that is what you are looking at.
Ten-minute diagnosis: run your homepage and your busiest landing page through PageSpeed Insights. Ignore the score. Read the field data at the top for the pass or fail, then open the LCP breakdown to see which of the four phases holds the time. If it is TTFB, talk to your host. If it is load duration, talk about images. If it is render delay, talk about scripts. That single reading is the difference between a two-day job and a two-month one.
Does any of this actually affect sales?
More honestly than it affects rankings, yes. Core Web Vitals are a genuine ranking signal but a modest one, and treating speed as an SEO strategy is a good way to spend money without moving the thing you care about. Speed matters because people leave. A visitor who arrived from a search result has no loyalty and a back button.
If enquiries are the problem rather than the traffic, speed is one candidate among several, and probably not the first. Why is my website not converting works through the others in order. If the problem is that nobody arrives at all, the sequence in why is my website not ranking is the right place to start instead.
Where we sit
We build sites that pass Core Web Vitals as a matter of course rather than as an add-on, because the two expensive causes above are both decided at build time. Fixed-price projects start from £2,500 and ship in two to four weeks, with the platform chosen for what the site has to do rather than what we prefer to build in.
If you have an existing site, the useful first step is the diagnosis rather than the work. Send us the URL and we will tell you which of the four phases is holding your time and whether it is a configuration job or a rebuild, which is a five-minute answer and frequently saves people from buying the wrong thing. Scope and pricing on the web design service page, and website maintenance costs covers keeping it fast afterwards.
Frequently asked questions
What is a good page load time in 2026?
Google does not measure page load time as a single number any more. It measures three Core Web Vitals at the 75th percentile of real visits: Largest Contentful Paint at 2.5 seconds or less, Interaction to Next Paint at 200 milliseconds or less, and Cumulative Layout Shift at 0.1 or less. A site can feel fast and still fail one of them, which is why a single stopwatch figure is not a useful target.
Why does my PageSpeed Insights score say 95 when the site feels slow?
Because the score is a lab test. Lighthouse loads your page once, on a simulated device, on a simulated connection, from wherever the test runs. Google's actual assessment uses field data from the Chrome User Experience Report, which is real Chrome users on real phones and real networks. The two disagree constantly. When they do, the field data is the one that counts, and it is shown in the same PageSpeed Insights report, above the score.
Does site speed affect Google rankings?
Yes, but less than most people are sold. Core Web Vitals are a ranking signal, and they are a tiebreaker rather than a lever. Being fast will not rank a page that does not answer the query. Being genuinely slow can hold back a page that otherwise deserves to rank. The stronger commercial argument is not ranking at all: slow pages lose people before they read anything.
Is my slow website the host's fault or the site's fault?
Look at Time to First Byte. It is the server's share of the load and Google suggests it should be around 40% of your Largest Contentful Paint. If TTFB alone is over a second, the bottleneck is hosting, database queries or an unlucky plugin, and no amount of image compression will fix it. If TTFB is fast and LCP is still poor, the problem is what the page downloads and renders after that, which is a build problem rather than a hosting one.
Will a faster host fix my Core Web Vitals?
It fixes one of the four phases. Time to First Byte is roughly 40% of LCP, so better hosting can meaningfully move the number, and cheap shared hosting is a real and common cause of slow UK sites. But resource load duration is another 40%, and that is your images, fonts and scripts. Moving a heavy site to a fast host usually improves it without passing it.
How much does it cost to fix a slow website?
It depends entirely on whether the cause is configuration or architecture. Compressing images, fixing missing dimensions, deferring third-party scripts and enabling caching is typically a day or two of work. Rebuilding a page that ships a megabyte of JavaScript to render a paragraph of text is not a speed fix, it is a rebuild, and it is priced as one. Get the diagnosis before anyone quotes you, because the two jobs differ by an order of magnitude.
Related guides: if the site is fast and still not found, read why is my website not ranking. If it is found and still not earning, read why is my website not converting. Choosing what to build it in is covered in which website platform should you use, and website redesign costs covers the point where a fix stops being a fix.